Mastering Gradient Infographic Design: A 4-Step Guide
Gradient infographic design is a powerful and visually appealing way to present information. It combines the smooth transitions of gradient colors with the clarity and structure of infographics, making data more engaging and easier to understand. Whether you're a designer, a marketer, or a business professional, mastering gradient infographic design can significantly enhance your communication and storytelling.
Understanding Gradient Infographics
A gradient infographic uses color gradients to create a visually dynamic and aesthetically pleasing representation of data. Gradients, which are gradual transitions between two or more colors, can add depth and dimension to your designs, making them stand out and capture the viewer's attention. This type of infographic is particularly useful for highlighting trends, comparisons, and hierarchies in a visually intuitive way.
The Purpose and Significance
The primary purpose of using gradients in infographics is to make the data more accessible and visually appealing. Gradients can help to:
- Highlight key information: By using different shades and hues, you can draw attention to the most important parts of your infographic.
- Create visual flow: Smooth transitions between colors can guide the viewer's eye through the content, making it easier to follow and understand.
- Add depth and dimension: Gradients can give a sense of depth to flat designs, making them appear more three-dimensional and engaging.
Practical Relevance in Modern Life
In today’s fast-paced digital world, where information is abundant and attention spans are short, effective visual communication is more important than ever. Gradient infographics are used across various fields, including:
- Business and Marketing: To present market trends, product features, and company performance in a visually compelling way.
- Education: To explain complex concepts, such as scientific processes or historical events, in an easy-to-understand format.
- Technology: To illustrate technical specifications, user guides, and system architectures in a clear and engaging manner.
4-Step Guide to Creating a Gradient Infographic
Creating a gradient infographic involves a structured process that ensures both aesthetic appeal and functional clarity. Here’s a step-by-step guide to help you design your own gradient infographic:
- Define Your Objective: Start by clearly defining what you want to communicate. Identify the key message, the target audience, and the main data points you need to include. This will help you stay focused and ensure that your infographic serves its intended purpose.
- Select Your Colors: Choose a color palette that aligns with your brand and the mood you want to set. For a gradient, select at least two colors that will blend smoothly. Consider using tools like Adobe Color or Coolors to find harmonious color combinations.
- Create the Gradient: Use graphic design software like Adobe Illustrator or Photoshop to create the gradient. You can apply the gradient to backgrounds, shapes, or text. Experiment with different gradient styles, such as linear, radial, or angular, to find the one that best suits your design.
- Organize and Layout Your Content: Arrange your data points and text in a logical and visually appealing way. Use hierarchy to guide the viewer’s eye, and make sure the most important information stands out. Add icons, charts, and other visual elements to enhance understanding and engagement.
Gradient Vector Infographic Design Template
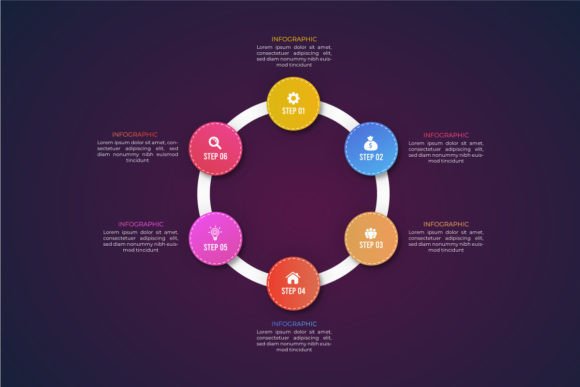
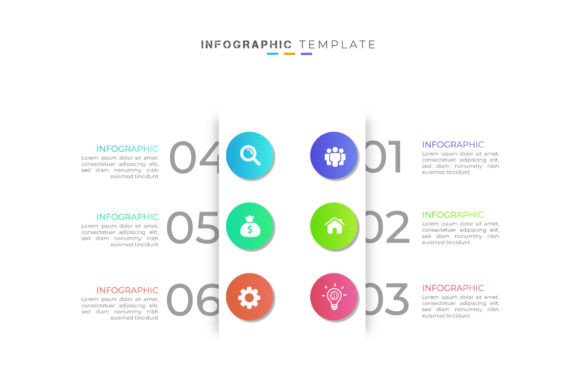
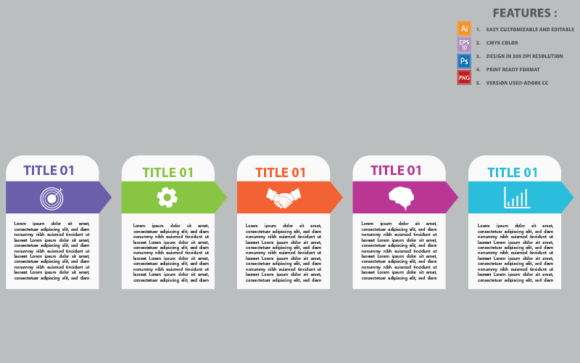
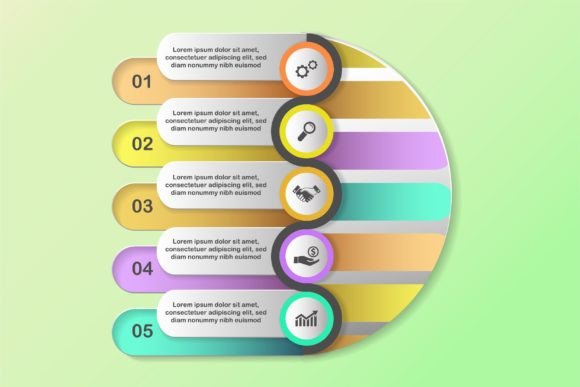
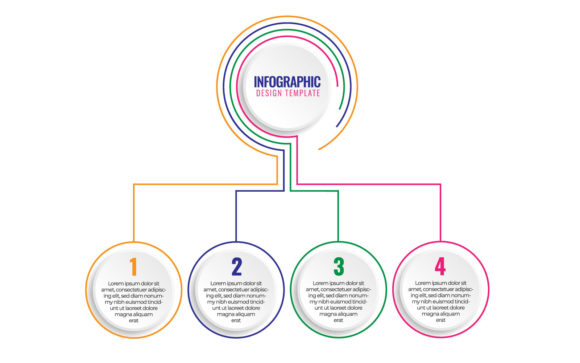
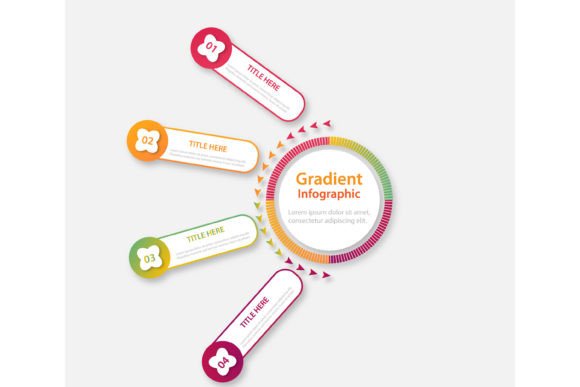
To help you get started, we provide a gradient vector infographic design template with 4 levels or steps. This template includes:
- Ai illustration (CC): A fully editable vector file in Adobe Illustrator format, allowing you to customize the design to your needs.
- EPS illustration (CC): An Encapsulated PostScript file, which is another high-quality vector format suitable for print and digital use.
- High-resolution JPG image: A ready-to-use image file that you can incorporate into presentations, reports, or web pages.
These files are designed to be versatile and easy to use, whether you are a beginner or an experienced designer. They provide a solid foundation for creating professional and visually appealing gradient infographics.
Common Misunderstandings and Tips
While gradient infographics are highly effective, there are some common misunderstandings and pitfalls to avoid:
- Overusing gradients: Too many gradients can make your design look cluttered and confusing. Use them sparingly and strategically to highlight key information.
- Ignoring accessibility: Ensure that your color choices are accessible to all viewers, including those with color blindness. Tools like the Coblis Color Blindness Simulator can help you test your design.
- Neglecting readability: Make sure that text and other important elements are legible against the gradient background. Use contrasting colors and clear fonts to enhance readability.
Building a Broader Understanding
By mastering gradient infographic design, you not only enhance your visual communication skills but also gain a deeper understanding of how to effectively present and share information. Whether you’re creating a marketing campaign, a business report, or an educational resource, gradient infographics can help you connect with your audience in a meaningful and memorable way.
Remember, the key to a successful gradient infographic is to balance aesthetics with functionality. Focus on clarity, simplicity, and the overall message you want to convey. With practice and the right tools, you can create stunning and impactful gradient infographics that leave a lasting impression.
For more resources and inspiration, check out our Gradient Infographic Resources page, where you can find tutorials, templates, and success stories from other designers.